신종 코로나바이러스 감염증(코로나 19)이라는 전례 없는 감염병의 발병으로 세계 각처에서 사회적 거리 두기가 일상화되고, 생활 방식의 극적인 변화를 경험하고 있습니다. 외출 시 마스크 착용은 필수가 되었고, 악수나 포옹 같은 접촉식 인사보다는 묵례와 눈인사와 같이 비접촉식 인사를 나누는 등 우리 일상의 많은 것들을 변화시켰습니다. 최근 미국 의학학술지 뉴잉글랜드저널오브메디신(NEJM)에 따르면 신종 코로나바이러스 감염증을 일으키는 사스코로나바이러스-2(SARS-CoV-2)가 면역이 떨어진 사람의 몸에서 변이 속도가 빠르다는 연구결과가 발표되었습니다. 이렇게 면역력의 중요성이 어느 때보다 강조되고 있는 시점에 면역에 대한 개념과 면역력을 높일 수 있는 일상 습관을 알아보도록 하겠습니다.
면역에 대한 개념
먼저 면역에 대한 개념에 대해서 알아보도록 하겠습니다.
면역(immunity)의 어원을 살펴보면 면제받은 사람(immunis)을 뜻하는 라틴어에서 비롯되었으며, 우리 몸이 바이러스에 감염되어도 멀쩡할 수 있었던 것은 선천면역, 그리고 감염 후 만들어지는 후천면역 덕분입니다.
선천면역이란 이전에 바이러스에 걸린 적이 없어도 우리 몸이 스스로 발휘하는 면역 기능을 말합니다. 바이러스가 인체의 피부, 장, 폐, 눈, 코에 침입하면 우선 이곳에 있는 상피세포들이 천연장벽 역할을 하며 일차적으로 막게 되고 이곳을 지나는 바이러스는 면역 세포들과 싸우기 시작합니다. 바이러스가 천연장벽을 통화하는 순간 면역세포들이 활성화되어 사이토킨, 자연살해 세포(NK세포), 대식세포, 백혈구 등이 바이러스가 장벽을 지난 후 고작 몇 분, 길어야 몇 시간 만에 나타나 대식세포는 바이러스를 잡아먹고, 자연살해 세포는 바이러스에 감염된 세포를 스스로 죽게 합니다. 이것이 염증반응인데, 이러한 작용이 격렬할수록 신체에는 발열, 두통, 식욕부진 등 증상이 크게 나타나기 시작합니다.
선천면역이 시작된 지 1~2주 후에도 바이러스가 우리 몸에 남아있다면 후천면역이 발동하게 됩니다. 선천면역과 후천면역의 가장 큰 차이점은 아군(self)과 적군(non-self, 항원)을 구분할 수 있다는 것입니다. 후천면역은 백혈구의 일종인 B세포와 T세포에 의해 이뤄지고, 적군을 골라내 죽이거나, 아직 감염되지 않은 세포가 감염되지 않도록 보호하는 역할을 하게 됩니다. 후천면역의 또 다른 특성은 한번 걸린 바이러스에 다시 걸리지 않거나, 쉽게 이겨낼 수 있게 되는데 후천면역을 통해 항체가 생성되었기 때문입니다. 예를 들면 어린아이들은 모기에 물리게 되면 손바닥만 하게 붓기도 하는데, 모기 알레르기라고도 불리는 이러한 현상은 아직 모기의 체액에 대한 항체가 형성되지 않았기 때문입니다. 자주 모기에 물려 익숙해지면 점점 면역 반응이 약해지는데, 이를 면역 관용(immunologic tolerance)이라 하며, 이를 이용해 내과나 이비인후과에서는 일부러 알레르기 항원을 조금씩 투약해 비염, 천식 등 알레르기 질환을 치료하기도 합니다.
면역력을 높일 수 있는 일상 습관
우리 몸의 면역력이 떨어지게 되면 감기에 자주 걸리고 구내염이 자주 생기거나 피로를 자주 느끼게 됩니다. 배탈이나 설사가 잦은 것도 면역력이 약해졌다는 증거이며 대상포진은 면역력이 떨어질 때 나타나는 대표적인 질환입니다. 몸 안에서 자체적으로 생성되는 면역력이 강해지면 병원균에 노출되더라도 1차 면역체계에서 제거하거나 발병하더라도 가볍게 앓고 지나갈 확률이 높게 됩니다. 이를 위해 간단한 생활습관을 통해 면역력을 높이는 방법을 알아보도록 하겠습니다.
킬러 세포로 불리는 T세포는 면역세포로 몸속에 암세포나 병든 세포를 공격해서 죽이는 기능을 담당하는데, 이 T세포가 비타민D에 의해 활성화됩니다. 비타민D를 따로 챙겨 먹지 않더라도 15분~20분 정도 충분히 햇볕을 쬐면 자연 비타민D를 생성해 T세포를 활성화해 면역력을 높일 수 있습니다.

[그림 1] "햇빛으로 생기는 비타민D 부족, 생각보다 훨씬 치명적" [파이낸셜뉴스]
장은 면역 기능의 70%를 담당하고 있으며, 장내 세균 생태계가 면역 세포를 자극하는 데 영향을 줍니다. 장내 유해균은 줄이고 유익균을 늘려야 하며, 채소, 과일 등의 섬유질을 섭취해 장내 연동 운동을 활발하게 하는 것이 중요합니다.
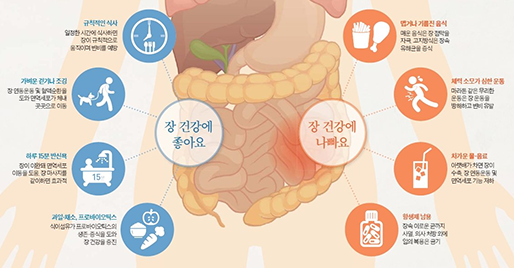
[그림 2] 유해균 공격, 면역세포 증식…장 건강 지켜 면역력 높인다 [중앙일보]
몸을 따뜻하게 하면 림프구가 활성화되면서 면역력이 높아지게 됩니다. 체온이 떨어지게 되면 면역력도 떨어지게 되는데, 체온 1도가 내려가면 신진대사 기능이 12% 내려간다는 연구 결과도 있습니다. 쉽게 체온을 올리는 방법에는 반신욕이 있으며, 체온을 높이는 것 외에도 혈액순환, 우울증 감소, 숙면에도 도움이 됩니다.
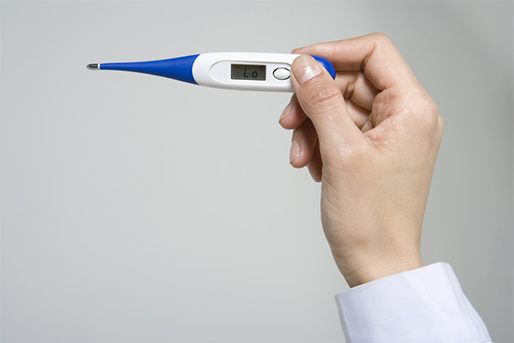
[그림 3] "적절한 체온 유지가 건강한 뇌와 신체를 만든다. [바이오타임즈]
밤 10시~새벽 2시 사이는 수면 호르몬인 멜라토닌이 활발하게 분비되는 시간이므로 이 시간 내에 반드시 수면을 취해 깊은 잠을 자도록 해야 합니다. 이 시간 내에 수면해야 성장호르몬이 분비되어 자가면역 역할을 하는 T림프구 증가에 도움을 주게 됩니다.
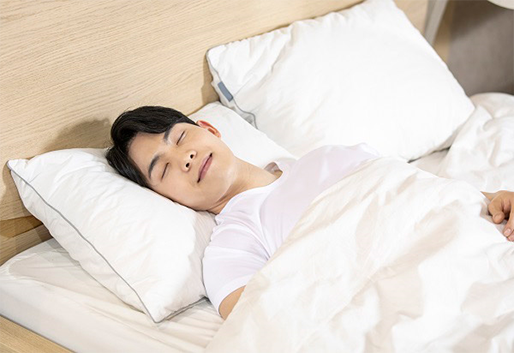
[그림 4] 대한수면학회 제안, 면역력 높이는 수면규칙 '5가지' [헬스조선]
림프계는 림프샘과 림프관으로 이루어져 있고, 림프샘은 림프구라는 면역세포가 외부로부터 들어오는 세균을 죽일 수 있게 단련시키는 곳입니다. 따라서 림프샘이 많이 모여 있는 목 주위, 겨드랑이, 서혜부 이 세 곳을 중심으로 가볍게 마사지해 주는 것이 좋습니다. 하루 10분 정도씩 해 주면 림프샘 면역력을 높이는 데 도움이 됩니다.
[그림 5] 바이러스 퇴치하는 면역 장기 3총사, ‘간-림프절-대장’ [하이닥]
마치며
바쁜 생활 속에서 습관처럼 찾는 소화제, 진통제, 위장약 등은 간의 해독 기능을 저하해 면역력을 떨어뜨리는 원인이 될 수 있습니다. 또한, 질환이 있어 약을 꾸준히 복용하는 사람일 경우 중복 섭취의 위험이 있어 부작용의 위험도 커지게 됩니다. 소화 불량이나 두통 등은 1~2시간이 지나면 자연 치유되는 경우가 많으니 습관적인 약 복용보다는 간단한 일상 습관의 변화를 통해 면역력을 높이는 것이 바이러스로부터 우리의 몸을 지키는 가장 쉬운 방법일 것입니다.
참고자료
Posted by 人Co


 입사지원서_성명_지원부문_20210800.docx


 人CoINTERNSHIP_지원서_2021.doc