[Quipu Issue Paper] Expression Study Ⅲ- Expression Pattern Analysis, Tissue Specific Gene Analysis
- Posted at 2010/02/25 09:24
- Filed under 생물정보
연재 순서
1. Assembly
2. Variation study
3. Expression study
4. Epigenomics
5. Genome Annotation
6. Next Generation Bioinformatics
7. Data Management for web 2.0 Era
8. Semantic Network for Integrated Biology Data
9. Gene Network Discovery by Text-mining
10. Centralization for High-throughput Data Analysis
이번 연재에서는 Next Generation Sequencing의 두 번째 Application인 Expression study 중에 Digital Expression Profile(DEP)를 활용한 Expression pattern 분석과 Tissue Specific Gene 분석에 대해 알아보겠습니다.
DEP를 활용하여 마이크로어레이 분석과 동일하게 다양한 조건에서의 유전자 발현을 분석한다. Fold change를 이용한 DEG 산출 및 hierarchical clustering, self-organizing maps, K-means clustering, PCA(Principle component analysis) 분석을 통해 의미 있는 발현 패턴들을 정교하게 표현하기도 하고, 이들 패턴들 간의 관계를 분석하기도 한다.
그림 4에서 보여 지는 것과 같이 모든 조직에서 일정한 비율로 발현되는 유전자는 house- keeping 유전자의 후보가 될 수 있으며, 유독 특정 조직에서만 발현되는 유전자들도 관찰 할 수 있다[2].
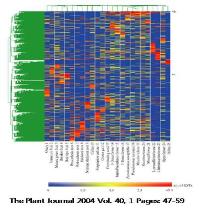 그림 4. DEP를 활용한 유전자 발현 패턴 분석.
Hierarchical clustering을 수행하여 동일한
패턴을 보이는 유전자들끼리 클러스터링 수행
이러한 발현 분석은 종전의 마이크로어레이 분석 프로그램으로 분석이 가능하다. 대표적인 예로 Agilent사의 GeneSpring GX을 들 수 있다[14]. 기본적인 통계학적 분석으로 ANOVA 분석, multiple testing corrections, FDR prediction 그리고 Tukey and Student-Newman-Keuls post hoc test 가 가능하며, 그래픽 데이터 표현으로는 2D/3D scatter plots, 2D dendrograms, 염색체 지도, pathway 다이어그램, 그리고 분류별 보기 기능으로 다양하게 표현이 가능하다.
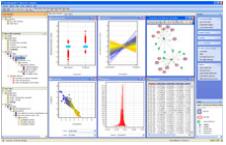 그림 5. GeneSpring GX.
유전자 발현데이터 분석 프로그램으로 다양한 통계 분석과 가시화 프로그램이 수행된다.
발현 패턴 분석으로는 gene trees, experiment trees, self-organizing maps, K-means clustering, QT clustering, 그리고 PCA 분석이 가능한 것으로 알려져 있다. 이 모든 기능은 데스크탑 컴퓨터에서 분석이 가능하며, 사용자 편의성이 강조된 인터페이스로 구성되어 있어, 비전문가도 쉽게 분석을 수행할 수 있다.
조직 특이 유전자는 특정 조직에서 그 유전자의 세포내 평균 발현 양 보다 특이적으로 높게 발현 되어 특정 조직의 성격을 결정지을 수 있는 유전자를 선별하는 것을 목적으로 한다.
따라서 NGS reads를 이용하여 분석하고자 할 때에는 조직별 라이브러리 제작 시 아무런
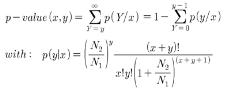
영향을 주지 않은 정상적인 발현 상태의 라이브러리를 제작해야하며, normalization이나 subtraction과 같은 인위적인 선출 방식의 시퀀싱이 아닌 무작위적인 방식의 시퀀싱이 진행되어야만 한다. 무작위 적으로 일어나는 사건에 대한 확률 값을 계산하므로 포아송 분포(poisson distribution)를 이용한 Audic’s test를 통해 조직 특이 유전자를 선별한다[8]. 다음은 Audic’s test를 이용한 확률 값을 구하는 수식이다.
 이 때, 다양한 cutoff 파라미터를 통해 확률적으로 유의한 유전자를 선별하는데, p_value, enrichment, frequency 그리고 클러스터내의 minimum reads count 등을 이용 할 수 있다. 이중 p_value는 유의 수준을 나타내는 것으로 0.001의 cutoff는 유의 수준 99.9%를 의미하게 된다. 그러나 조직 특이 유전자 선별을 위해 한 두 개의 유전자를 대상으로 연관성 분석이 진행 되는 것이 아니라 앞서 언급된 파라미터를 통과한 모든 클러스터를 대상으로 연관성 분석이 진행하므로 검사의 개수가 증가할수록 임의로 발생하는 오류 또한 증가하여 p_value의 의미가 감소하는 문제점이 발생하게 된다. 이를 극복하기 위해 Bonferroni correction, False Discovery Rate(FDR), 그리고 Permutation test와 같은 다중 검정을 수행하게 된다[6, 7].
실제 분석을 위해 앞서 작성한 Cluster Member Matrix(CMM; DEP작성시 초기 matrix)를 이용하여 각 클러스터별로 x, y, N1, N2을 지정하여 계산할 수 있다[16]. 예를 들어 그림 3의 표에서 클러스터 1의 유전자가 ‘OC’ 조직에 특이적인 발현 양을 보이는지를 검사 한다고 했을 때 대상 조직의 reads 개수인 y 는 ‘10’이 되고 그 외 나머지 조직에 해당하는 reads 개수인 x 는 ‘82’가 된다. 그리고 N2, N1 은 각각 해당 조직 전체 reads 개수와 나머지 조직의 전체 reads 개수인 ‘55,840’과 ‘184,301’에 해당한다. 이러한 분석은 하나의 클러스터마다 검사해야할 조직 개수만큼 수행된다.
이번주에 이어서 다음 주에 진행될 연재에서도 Expression study의 다양한 분석 방법에 대해 연재가 될 예정입니다. 많은 관심 부탁드립니다.
2. Fei Z, Tang X, Alba RM, White JA, Ronning CM, Martin GB, Tanksley SD, Giovannoni JJ. (2004) Comprehensive EST analysis of tomato and comparative genomics of fruit ripening. Plant J. 40, 47–59
3. Rensink WA, Lee Y, Liu J, Iobst S, Ouyang S, Buell CR. (2005) Comparative analyses of six solanaceous transcriptomes reveal a high degree of sequence conservation and species-specific transcripts. BMC Genomics. 6, 124
4. Ronning,C.M. et al. (2003) Comparative analyses of potato expressed sequence tag libraries. Plant Physiol. 131, 419–429
5. Guo J, Zhu P, Wu C, Yu L, Zhao S, Gu X. (2003) In silico analysis indicates a similar gene expression pattern between human brain and testis. Cytogenet Genome Res. 103, 58-62
6. Benjamini, Y., Daniel Yekutieli. (2001) The control of the false discovery rate in multiple hypotheses testing under dependency. Annal. Stat. 4(29), 1165–1188
7. Tsai CA, Hsueh HM, Chen JJ. (2003) Estimation of false discovery rates in multiple testing: application to gene microarray data. Biometrics. 59, 1071-81
8. Audic S, Claverie JM. (1997) The significance of digital gene expression profiles. Genome Res. 7, 986–995
9. Roche 454 : Products & Solutions - Multiplexing
(http://www.454.com/products-solutions/experimental-design-options/multiplexing.asp)
10. Tatusov RL, Koonin EV, Lipman DJ. (1997) A genomic perspective on protein families. Science. 278, 631-637
11. Kato T, Murata Y, Miura K, Asai K, Horton PB, Koji T, Fujibuchi W. (2006) Network-based de-noising improves prediction from microarray data, BMC Bioinformatics. 7, S4
12. Noh SJ, Lee K, Paik H, Hur CG. (2006) TISA: tissue-specific alternative splicing in human and mouse genes. DNA Res. 5, 229-243
13. Zeeberg BR, Feng W, Wang G, Wang MD, Fojo AT, Sunshine M, Narasimhan S, Kane DW, Reinhold WC, Lababidi S, Bussey KJ, Riss J, Barrett JC, Weinstein JN. (2003) GoMiner: a resource for biological interpretation of genomic and proteomic data, Genome Biol. 4, R28
14. GeneSpring GX : Products & Services - GeneSpring GX Software
(http://www.chem.agilent.com/en-US/products/software/lifesciencesinformatics/genespringgx/pages/default.aspx)
15. Wingender E, Chen X, Hehl R, Karas H, Liebich I, Matys V, Meinhardt T, Prüss M, Reuter I, Schacherer F. (2000) TRANSFAC: an integrated system for gene expression regulation. Nucleic Acids Research. 28, 316-319
16. PathwayStudio : Products-pathway Studio
(http://www.ariadnegenomics.com/products/pathwaystudio/)
17. Eveland AL, McCarty DR, Koch KE. (2007) Transcript profiling by 3'-untranslated region sequencing resolves expression of gene families. Plant Physiol. 146, 32-44.
18. Torres TT, Metta M, Ottenwälder B, Schlötterer C. (2008) Gene expression profiling by massively parallel sequencing. Genome Res. 1, 172-7.
19. Vega-Arreguín JC, Ibarra-Laclette E, Jiménez-Moraila B, Martínez O, Vielle-Calzada JP, Herrera-Estrella L, Herrera-Estrella A. (2009) Deep sampling of the Palomero maize transcriptome by a high throughput strategy of pyrosequencing. BMC Genomics. 10, 299.
20. Wang ET, Sandberg R, Luo S, Khrebtukova I, Zhang L, Mayr C, Kingsmore SF, Schroth GP, Burge CB. (2008) Alternative isoform regulation in human tissue transcriptomes. Nature. 2456, 70-76.
21. Johnson JM, Castle J, Garrett-Engele P, Kan Z, Loerch PM, Armour CD, Santos R, Schadt EE, Stoughton R, Shoemaker DD. (2003) Genome-wide survey of human alternative pre-mRNA splicing with exon junction microarrays. Science. 302, 2141-2144.
22. Ledford H. (2008) Human genes are multitaskers. Nature. 456, 9.
23. CLC Genomics Workbench: RNA-Seq analysis
(http://www.clcbio.com/index.php?id=1330&manual=RNA_Seq_analysis.html)
1. Assembly
2. Variation study
3. Expression study
4. Epigenomics
5. Genome Annotation
6. Next Generation Bioinformatics
7. Data Management for web 2.0 Era
8. Semantic Network for Integrated Biology Data
9. Gene Network Discovery by Text-mining
10. Centralization for High-throughput Data Analysis
이번 연재에서는 Next Generation Sequencing의 두 번째 Application인 Expression study 중에 Digital Expression Profile(DEP)를 활용한 Expression pattern 분석과 Tissue Specific Gene 분석에 대해 알아보겠습니다.
2-2-2. Expression Pattern Analysis
DEP를 활용하여 마이크로어레이 분석과 동일하게 다양한 조건에서의 유전자 발현을 분석한다. Fold change를 이용한 DEG 산출 및 hierarchical clustering, self-organizing maps, K-means clustering, PCA(Principle component analysis) 분석을 통해 의미 있는 발현 패턴들을 정교하게 표현하기도 하고, 이들 패턴들 간의 관계를 분석하기도 한다.
그림 4에서 보여 지는 것과 같이 모든 조직에서 일정한 비율로 발현되는 유전자는 house- keeping 유전자의 후보가 될 수 있으며, 유독 특정 조직에서만 발현되는 유전자들도 관찰 할 수 있다[2].
Hierarchical clustering을 수행하여 동일한
패턴을 보이는 유전자들끼리 클러스터링 수행
조직뿐만 아니라 약물에 대한 반응성 실험을 수행 할 경우에도 time-series 라이브러리를 제작하고 여러 샘플을 한 번에 시퀀싱 할 수 있는 Multiplex Identifiers(MIDs)를 이용하여 단 시간에 많은 데이터로 이 같은 분석을 진행할 수 있다. Roche 454의 경우 192에서 최대 2300 개의 샘플을 한 번에 로딩하여 시퀀싱이 가능할 정도로 유연성이 있으므로 다양한 조건을 대상으로 분석에 활용할 수 있는 이점이 있다[9].
이러한 발현 분석은 종전의 마이크로어레이 분석 프로그램으로 분석이 가능하다. 대표적인 예로 Agilent사의 GeneSpring GX을 들 수 있다[14]. 기본적인 통계학적 분석으로 ANOVA 분석, multiple testing corrections, FDR prediction 그리고 Tukey and Student-Newman-Keuls post hoc test 가 가능하며, 그래픽 데이터 표현으로는 2D/3D scatter plots, 2D dendrograms, 염색체 지도, pathway 다이어그램, 그리고 분류별 보기 기능으로 다양하게 표현이 가능하다.
유전자 발현데이터 분석 프로그램으로 다양한 통계 분석과 가시화 프로그램이 수행된다.
발현 패턴 분석으로는 gene trees, experiment trees, self-organizing maps, K-means clustering, QT clustering, 그리고 PCA 분석이 가능한 것으로 알려져 있다. 이 모든 기능은 데스크탑 컴퓨터에서 분석이 가능하며, 사용자 편의성이 강조된 인터페이스로 구성되어 있어, 비전문가도 쉽게 분석을 수행할 수 있다.
2-2-3. Tissue Specific Gene Analysis
조직 특이 유전자는 특정 조직에서 그 유전자의 세포내 평균 발현 양 보다 특이적으로 높게 발현 되어 특정 조직의 성격을 결정지을 수 있는 유전자를 선별하는 것을 목적으로 한다.
따라서 NGS reads를 이용하여 분석하고자 할 때에는 조직별 라이브러리 제작 시 아무런
영향을 주지 않은 정상적인 발현 상태의 라이브러리를 제작해야하며, normalization이나 subtraction과 같은 인위적인 선출 방식의 시퀀싱이 아닌 무작위적인 방식의 시퀀싱이 진행되어야만 한다. 무작위 적으로 일어나는 사건에 대한 확률 값을 계산하므로 포아송 분포(poisson distribution)를 이용한 Audic’s test를 통해 조직 특이 유전자를 선별한다[8]. 다음은 Audic’s test를 이용한 확률 값을 구하는 수식이다.
실제 분석을 위해 앞서 작성한 Cluster Member Matrix(CMM; DEP작성시 초기 matrix)를 이용하여 각 클러스터별로 x, y, N1, N2을 지정하여 계산할 수 있다[16]. 예를 들어 그림 3의 표에서 클러스터 1의 유전자가 ‘OC’ 조직에 특이적인 발현 양을 보이는지를 검사 한다고 했을 때 대상 조직의 reads 개수인 y 는 ‘10’이 되고 그 외 나머지 조직에 해당하는 reads 개수인 x 는 ‘82’가 된다. 그리고 N2, N1 은 각각 해당 조직 전체 reads 개수와 나머지 조직의 전체 reads 개수인 ‘55,840’과 ‘184,301’에 해당한다. 이러한 분석은 하나의 클러스터마다 검사해야할 조직 개수만큼 수행된다.
이번주에 이어서 다음 주에 진행될 연재에서도 Expression study의 다양한 분석 방법에 대해 연재가 될 예정입니다. 많은 관심 부탁드립니다.
참고문헌
1. Mortazavi A, Williams BA, McCue K, Schaeffer L, Wold B. (2008) Mapping and quantifying mammalian transcriptomes by RNA-Seq. Nat Methods. 7, 621-628.2. Fei Z, Tang X, Alba RM, White JA, Ronning CM, Martin GB, Tanksley SD, Giovannoni JJ. (2004) Comprehensive EST analysis of tomato and comparative genomics of fruit ripening. Plant J. 40, 47–59
3. Rensink WA, Lee Y, Liu J, Iobst S, Ouyang S, Buell CR. (2005) Comparative analyses of six solanaceous transcriptomes reveal a high degree of sequence conservation and species-specific transcripts. BMC Genomics. 6, 124
4. Ronning,C.M. et al. (2003) Comparative analyses of potato expressed sequence tag libraries. Plant Physiol. 131, 419–429
5. Guo J, Zhu P, Wu C, Yu L, Zhao S, Gu X. (2003) In silico analysis indicates a similar gene expression pattern between human brain and testis. Cytogenet Genome Res. 103, 58-62
6. Benjamini, Y., Daniel Yekutieli. (2001) The control of the false discovery rate in multiple hypotheses testing under dependency. Annal. Stat. 4(29), 1165–1188
7. Tsai CA, Hsueh HM, Chen JJ. (2003) Estimation of false discovery rates in multiple testing: application to gene microarray data. Biometrics. 59, 1071-81
8. Audic S, Claverie JM. (1997) The significance of digital gene expression profiles. Genome Res. 7, 986–995
9. Roche 454 : Products & Solutions - Multiplexing
(http://www.454.com/products-solutions/experimental-design-options/multiplexing.asp)
10. Tatusov RL, Koonin EV, Lipman DJ. (1997) A genomic perspective on protein families. Science. 278, 631-637
11. Kato T, Murata Y, Miura K, Asai K, Horton PB, Koji T, Fujibuchi W. (2006) Network-based de-noising improves prediction from microarray data, BMC Bioinformatics. 7, S4
12. Noh SJ, Lee K, Paik H, Hur CG. (2006) TISA: tissue-specific alternative splicing in human and mouse genes. DNA Res. 5, 229-243
13. Zeeberg BR, Feng W, Wang G, Wang MD, Fojo AT, Sunshine M, Narasimhan S, Kane DW, Reinhold WC, Lababidi S, Bussey KJ, Riss J, Barrett JC, Weinstein JN. (2003) GoMiner: a resource for biological interpretation of genomic and proteomic data, Genome Biol. 4, R28
14. GeneSpring GX : Products & Services - GeneSpring GX Software
(http://www.chem.agilent.com/en-US/products/software/lifesciencesinformatics/genespringgx/pages/default.aspx)
15. Wingender E, Chen X, Hehl R, Karas H, Liebich I, Matys V, Meinhardt T, Prüss M, Reuter I, Schacherer F. (2000) TRANSFAC: an integrated system for gene expression regulation. Nucleic Acids Research. 28, 316-319
16. PathwayStudio : Products-pathway Studio
(http://www.ariadnegenomics.com/products/pathwaystudio/)
17. Eveland AL, McCarty DR, Koch KE. (2007) Transcript profiling by 3'-untranslated region sequencing resolves expression of gene families. Plant Physiol. 146, 32-44.
18. Torres TT, Metta M, Ottenwälder B, Schlötterer C. (2008) Gene expression profiling by massively parallel sequencing. Genome Res. 1, 172-7.
19. Vega-Arreguín JC, Ibarra-Laclette E, Jiménez-Moraila B, Martínez O, Vielle-Calzada JP, Herrera-Estrella L, Herrera-Estrella A. (2009) Deep sampling of the Palomero maize transcriptome by a high throughput strategy of pyrosequencing. BMC Genomics. 10, 299.
20. Wang ET, Sandberg R, Luo S, Khrebtukova I, Zhang L, Mayr C, Kingsmore SF, Schroth GP, Burge CB. (2008) Alternative isoform regulation in human tissue transcriptomes. Nature. 2456, 70-76.
21. Johnson JM, Castle J, Garrett-Engele P, Kan Z, Loerch PM, Armour CD, Santos R, Schadt EE, Stoughton R, Shoemaker DD. (2003) Genome-wide survey of human alternative pre-mRNA splicing with exon junction microarrays. Science. 302, 2141-2144.
22. Ledford H. (2008) Human genes are multitaskers. Nature. 456, 9.
23. CLC Genomics Workbench: RNA-Seq analysis
(http://www.clcbio.com/index.php?id=1330&manual=RNA_Seq_analysis.html)
Posted by 人Co
- Tag
- ANOVA, Audic's test, Cluster Member Matrix, clustering, DEG, DEP, Expression study, FDR, GeneSpring GX, house-keeping, insilicogen, K-means, MIDs, NGS, pattern 분석, PCA, Tissue Specific Gene, 마이크로어레이, 인실리코젠, 조직 특이 유전자, 포아송 분포
- Response
- No Trackback , No Comment
- RSS :
- https://post-blog.insilicogen.com/blog/rss/response/47