[Quipu Issue Paper] Expression Study Ⅳ- Ortholog Analysis, Differentially Expressed Genes(DEGs) Functional annotation
- Posted at 2010/03/02 09:44
- Filed under 생물정보
연재 순서
1. Assembly
2. Variation study
3. Expression study
4. Epigenomics
5. Genome Annotation
6. Next Generation Bioinformatics
7. Data Management for web 2.0 Era
8. Semantic Network for Integrated Biology Data
9. Gene Network Discovery by Text-mining
10. Centralization for High-throughput Data Analysis
이 번주 연재에서도 지난주에 이어 Next Generation Sequencing의 두 번째 Application인 Expression study에 대한 내용으로 연재가 진행될 예정입니다. 오늘은 서로 다른 종에서 동일한 기능을 수행하는 ortholog 유전자를 분석하는 방법과 Differentially Expressed Genes(DEGs) Functional annotation 중에 Gene Categorization을 이용한 Hypergeometric test에 대해 알아보겠습니다.
서로 다른 종에서 동일한 기능을 수행하는 유전자들의 관계를 ortholog 유전자라고 한다. 일반적인 분석법으로는 서열 유사성을 근간으로 분석이 진행된다. COG 알고리즘에 의하면 최소 세 종 이상의 유전자가 서로 top match로 연결이 될 때 비로소 하나의 ortholog 그룹을 형성하는 것으로 분석하고 있다[18]. 그러나 이러한 분석법에는 어느 정도의 노이즈가 존재 하므로 이를 해결하려는 시도로 여러 가지 분석법이 소개 되었다. 그중 서열 유사성에 synteny를 접목한 분석법과 발현 패턴을 이용한 분석법이 있다. 여기서는 발현 패턴을 이용한 분석법에 대해 알아보자.
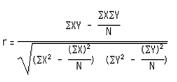
동일한 기능을 수행한다면 동일한 발현 패턴으로 조절될 것이라는 가정 하에 일정 수준 이상의 서열 유사성을 갖는 유전자들끼리 DEP를 활용한 Pearson’s correlation coefficient를 분석하여 ortholog 유전자를 찾는 방법이다. 다음은 Pearson's correlation coefficient 인 ‘r’을 구하는 수식이다.
 두 단계로 진행되는 분석으로 일차 분석은 서열 유사성 검사이다. 단백질 수준으로 BLAST를 수행하여 일정 수준 이상의 homology를 갖는 유전자는 모두 분석 대상으로 한다.
그림 3의 unigene 1과 가장 서열상 유사한 유전자를 human을 대상으로 분석하고자 할 때 보통 e-value를 파라미터로 하여 일정 수준(‘1e-10’)을 통과하는 유전자를 2차 분석 대상자로 분류한다. 2차 분석에서는 DEP를 활용한 Pearson’s correlation coefficient를 분석한다.
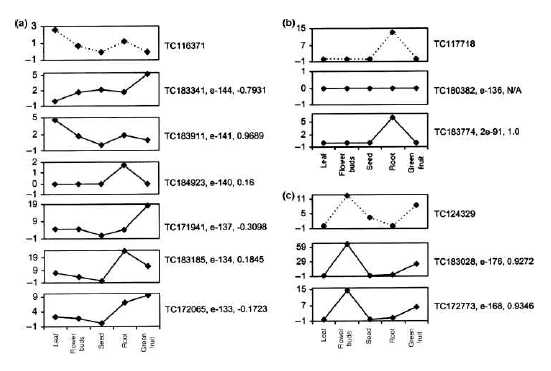 그림 6. DEP를 활용한 ortholog 유전자 분석.
Tomato와 arabidopsis 유전자 간의 DEP를 5개의 조직에 대해 작성하여 서열 유사성과 발현 패턴을 비교하여 ortholog 유전자를 분석하였다. (a) 서열유사성으로는 tomato의 TC-116371 (peroxidase)과 arabidopsis의 TC- 183341 이 가장 유사하지만 발현패턴과 함께 비교하면 TC183911이 ortholog 유전자가 됨을 확인수 있었다. (b), (c) 모두 동일한 결과를 보이고 있다[2].
단, DEP의 라이브러리 구성이 두 종간에 서로 일치하여야 한다. Cluster 1(Unigene 1)의 DEP와 human의 후보 유전자 DEP를 1:1로 correlation 분석을 진행하여 coefficient value ‘r’이 ‘1’에 가까울수록 서로 유사한 상관관계를 가지며, ‘-1’에 가까울수록 반대되는 상관관계를 가지고, ‘0’에 가까울수록 상관관계가 없는 것으로 해석한다[10, 19] 이러한 결과는 그림 6의 예제에서 보다 정확한 ortholog 분석 결과를 보여 주고 있다.
앞서 소개한 DEP를 활용하여 유전자 발현 패턴을 분석하면 특정 컨디션에서 높은 발현을 보이는 Differentially Expressed Genes(DEGs)을 얻을 수 있다. 같은 맥락의 조직특이 유전자들도 이에 해당 하는 것으로 이들은 특정 조건으로 묶인 만큼 공통된 생물학적 기능을 갖을 것이라 기대 하고 있다. 이를 분석 하기 위해 gene categorization을 이용한 통계학적 분석과 텍스트 마이닝을 통한 대사회로 분석 및 발현 조절 부위 분석을 진행하게 된다.
Gene Ontology(GO)와 같이 organism 내의 모든 유전자를 카테고리화하여 유전자 구성이 어떻게 되는지를 분석하는 것은 유전자의 기능 분석에서 일반적인 분석법 중 하나이다. 이러한 카테고리 구성 방식은 GO와 함께 MIPS의 FunCat도 많이 이용되고 있는데, 이들을 이용하여 DEG와 같은 특정 요건으로 묶인 유전자들의 기능이 어떤 카테고리에 집중되어 있는지를 hypergeometric test를 이용하여 분석한다[12, 13]. Hypergeometric test의 확률 값을 구하는 수식은 다음과 같다.
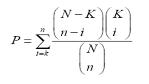 여기서 ‘N’은 organism 전체의 유전자 개수를 의미하며 ‘n’은 DEGs의 개수를 의미 한다. 그리고 ‘K’는 전체 유전자 중 특정 카테고리 X(예:GO:00000345)에 해당하는 유전자 개수 이며, ‘i’는 DEGs 그룹 중 특정 카테고리 X에 해당하는 유전자 수를 의미한다. P-value cutoff와 enrichment를 이용하여 통계학적으로 유의한 유전자의 기능을 규명한다. 이러한 분석은 다중 검정을 통해 발생할 수 있는 오류를 보정 하게 된다(2-2-3. 조직특이 유전자 분석 참조).
다음 연재에서는 Differentially Expressed Genes(DEGs) Functional annotation 중에 Text-mining을 통한 회사대로 분석, Promoter 영역 분석을 통한 발현 조절 메카니즘 분석과 RNA-Seq 분석 방법에 대해 알아보도록 하겠습니다. 많은 관심 부탁드립니다.
2. Fei Z, Tang X, Alba RM, White JA, Ronning CM, Martin GB, Tanksley SD, Giovannoni JJ. (2004) Comprehensive EST analysis of tomato and comparative genomics of fruit ripening. Plant J. 40, 47–59
3. Rensink WA, Lee Y, Liu J, Iobst S, Ouyang S, Buell CR. (2005) Comparative analyses of six solanaceous transcriptomes reveal a high degree of sequence conservation and species-specific transcripts. BMC Genomics. 6, 124
4. Ronning,C.M. et al. (2003) Comparative analyses of potato expressed sequence tag libraries. Plant Physiol. 131, 419–429
5. Guo J, Zhu P, Wu C, Yu L, Zhao S, Gu X. (2003) In silico analysis indicates a similar gene expression pattern between human brain and testis. Cytogenet Genome Res. 103, 58-62
6. Benjamini, Y., Daniel Yekutieli. (2001) The control of the false discovery rate in multiple hypotheses testing under dependency. Annal. Stat. 4(29), 1165–1188
7. Tsai CA, Hsueh HM, Chen JJ. (2003) Estimation of false discovery rates in multiple testing: application to gene microarray data. Biometrics. 59, 1071-81
8. Audic S, Claverie JM. (1997) The significance of digital gene expression profiles. Genome Res. 7, 986–995
9. Roche 454 : Products & Solutions - Multiplexing
(http://www.454.com/products-solutions/experimental-design-options/multiplexing.asp)
10. Tatusov RL, Koonin EV, Lipman DJ. (1997) A genomic perspective on protein families. Science. 278, 631-637
11. Kato T, Murata Y, Miura K, Asai K, Horton PB, Koji T, Fujibuchi W. (2006) Network-based de-noising improves prediction from microarray data, BMC Bioinformatics. 7, S4
12. Noh SJ, Lee K, Paik H, Hur CG. (2006) TISA: tissue-specific alternative splicing in human and mouse genes. DNA Res. 5, 229-243
13. Zeeberg BR, Feng W, Wang G, Wang MD, Fojo AT, Sunshine M, Narasimhan S, Kane DW, Reinhold WC, Lababidi S, Bussey KJ, Riss J, Barrett JC, Weinstein JN. (2003) GoMiner: a resource for biological interpretation of genomic and proteomic data, Genome Biol. 4, R28
14. GeneSpring GX : Products & Services - GeneSpring GX Software
(http://www.chem.agilent.com/en-US/products/software/lifesciencesinformatics/genespringgx/pages/default.aspx)
15. Wingender E, Chen X, Hehl R, Karas H, Liebich I, Matys V, Meinhardt T, Prüss M, Reuter I, Schacherer F. (2000) TRANSFAC: an integrated system for gene expression regulation. Nucleic Acids Research. 28, 316-319
16. PathwayStudio : Products-pathway Studio
(http://www.ariadnegenomics.com/products/pathwaystudio/)
17. Eveland AL, McCarty DR, Koch KE. (2007) Transcript profiling by 3'-untranslated region sequencing resolves expression of gene families. Plant Physiol. 146, 32-44.
18. Torres TT, Metta M, Ottenwälder B, Schlötterer C. (2008) Gene expression profiling by massively parallel sequencing. Genome Res. 1, 172-7.
19. Vega-Arreguín JC, Ibarra-Laclette E, Jiménez-Moraila B, Martínez O, Vielle-Calzada JP, Herrera-Estrella L, Herrera-Estrella A. (2009) Deep sampling of the Palomero maize transcriptome by a high throughput strategy of pyrosequencing. BMC Genomics. 10, 299.
20. Wang ET, Sandberg R, Luo S, Khrebtukova I, Zhang L, Mayr C, Kingsmore SF, Schroth GP, Burge CB. (2008) Alternative isoform regulation in human tissue transcriptomes. Nature. 2456, 70-76.
21. Johnson JM, Castle J, Garrett-Engele P, Kan Z, Loerch PM, Armour CD, Santos R, Schadt EE, Stoughton R, Shoemaker DD. (2003) Genome-wide survey of human alternative pre-mRNA splicing with exon junction microarrays. Science. 302, 2141-2144.
22. Ledford H. (2008) Human genes are multitaskers. Nature. 456, 9.
23. CLC Genomics Workbench: RNA-Seq analysis
(http://www.clcbio.com/index.php?id=1330&manual=RNA_Seq_analysis.html)
1. Assembly
2. Variation study
3. Expression study
4. Epigenomics
5. Genome Annotation
6. Next Generation Bioinformatics
7. Data Management for web 2.0 Era
8. Semantic Network for Integrated Biology Data
9. Gene Network Discovery by Text-mining
10. Centralization for High-throughput Data Analysis
이 번주 연재에서도 지난주에 이어 Next Generation Sequencing의 두 번째 Application인 Expression study에 대한 내용으로 연재가 진행될 예정입니다. 오늘은 서로 다른 종에서 동일한 기능을 수행하는 ortholog 유전자를 분석하는 방법과 Differentially Expressed Genes(DEGs) Functional annotation 중에 Gene Categorization을 이용한 Hypergeometric test에 대해 알아보겠습니다.
2-2-4. Ortholog Analysis
서로 다른 종에서 동일한 기능을 수행하는 유전자들의 관계를 ortholog 유전자라고 한다. 일반적인 분석법으로는 서열 유사성을 근간으로 분석이 진행된다. COG 알고리즘에 의하면 최소 세 종 이상의 유전자가 서로 top match로 연결이 될 때 비로소 하나의 ortholog 그룹을 형성하는 것으로 분석하고 있다[18]. 그러나 이러한 분석법에는 어느 정도의 노이즈가 존재 하므로 이를 해결하려는 시도로 여러 가지 분석법이 소개 되었다. 그중 서열 유사성에 synteny를 접목한 분석법과 발현 패턴을 이용한 분석법이 있다. 여기서는 발현 패턴을 이용한 분석법에 대해 알아보자.
동일한 기능을 수행한다면 동일한 발현 패턴으로 조절될 것이라는 가정 하에 일정 수준 이상의 서열 유사성을 갖는 유전자들끼리 DEP를 활용한 Pearson’s correlation coefficient를 분석하여 ortholog 유전자를 찾는 방법이다. 다음은 Pearson's correlation coefficient 인 ‘r’을 구하는 수식이다.
그림 3의 unigene 1과 가장 서열상 유사한 유전자를 human을 대상으로 분석하고자 할 때 보통 e-value를 파라미터로 하여 일정 수준(‘1e-10’)을 통과하는 유전자를 2차 분석 대상자로 분류한다. 2차 분석에서는 DEP를 활용한 Pearson’s correlation coefficient를 분석한다.
단, DEP의 라이브러리 구성이 두 종간에 서로 일치하여야 한다. Cluster 1(Unigene 1)의 DEP와 human의 후보 유전자 DEP를 1:1로 correlation 분석을 진행하여 coefficient value ‘r’이 ‘1’에 가까울수록 서로 유사한 상관관계를 가지며, ‘-1’에 가까울수록 반대되는 상관관계를 가지고, ‘0’에 가까울수록 상관관계가 없는 것으로 해석한다[10, 19] 이러한 결과는 그림 6의 예제에서 보다 정확한 ortholog 분석 결과를 보여 주고 있다.
2-2-5. Differentially Expressed Genes (DEGs) Functional annotation
앞서 소개한 DEP를 활용하여 유전자 발현 패턴을 분석하면 특정 컨디션에서 높은 발현을 보이는 Differentially Expressed Genes(DEGs)을 얻을 수 있다. 같은 맥락의 조직특이 유전자들도 이에 해당 하는 것으로 이들은 특정 조건으로 묶인 만큼 공통된 생물학적 기능을 갖을 것이라 기대 하고 있다. 이를 분석 하기 위해 gene categorization을 이용한 통계학적 분석과 텍스트 마이닝을 통한 대사회로 분석 및 발현 조절 부위 분석을 진행하게 된다.
A. Gene Categorization을 이용한 Hypergeometric test
Gene Ontology(GO)와 같이 organism 내의 모든 유전자를 카테고리화하여 유전자 구성이 어떻게 되는지를 분석하는 것은 유전자의 기능 분석에서 일반적인 분석법 중 하나이다. 이러한 카테고리 구성 방식은 GO와 함께 MIPS의 FunCat도 많이 이용되고 있는데, 이들을 이용하여 DEG와 같은 특정 요건으로 묶인 유전자들의 기능이 어떤 카테고리에 집중되어 있는지를 hypergeometric test를 이용하여 분석한다[12, 13]. Hypergeometric test의 확률 값을 구하는 수식은 다음과 같다.
다음 연재에서는 Differentially Expressed Genes(DEGs) Functional annotation 중에 Text-mining을 통한 회사대로 분석, Promoter 영역 분석을 통한 발현 조절 메카니즘 분석과 RNA-Seq 분석 방법에 대해 알아보도록 하겠습니다. 많은 관심 부탁드립니다.
참고문헌
1. Mortazavi A, Williams BA, McCue K, Schaeffer L, Wold B. (2008) Mapping and quantifying mammalian transcriptomes by RNA-Seq. Nat Methods. 7, 621-628.2. Fei Z, Tang X, Alba RM, White JA, Ronning CM, Martin GB, Tanksley SD, Giovannoni JJ. (2004) Comprehensive EST analysis of tomato and comparative genomics of fruit ripening. Plant J. 40, 47–59
3. Rensink WA, Lee Y, Liu J, Iobst S, Ouyang S, Buell CR. (2005) Comparative analyses of six solanaceous transcriptomes reveal a high degree of sequence conservation and species-specific transcripts. BMC Genomics. 6, 124
4. Ronning,C.M. et al. (2003) Comparative analyses of potato expressed sequence tag libraries. Plant Physiol. 131, 419–429
5. Guo J, Zhu P, Wu C, Yu L, Zhao S, Gu X. (2003) In silico analysis indicates a similar gene expression pattern between human brain and testis. Cytogenet Genome Res. 103, 58-62
6. Benjamini, Y., Daniel Yekutieli. (2001) The control of the false discovery rate in multiple hypotheses testing under dependency. Annal. Stat. 4(29), 1165–1188
7. Tsai CA, Hsueh HM, Chen JJ. (2003) Estimation of false discovery rates in multiple testing: application to gene microarray data. Biometrics. 59, 1071-81
8. Audic S, Claverie JM. (1997) The significance of digital gene expression profiles. Genome Res. 7, 986–995
9. Roche 454 : Products & Solutions - Multiplexing
(http://www.454.com/products-solutions/experimental-design-options/multiplexing.asp)
10. Tatusov RL, Koonin EV, Lipman DJ. (1997) A genomic perspective on protein families. Science. 278, 631-637
11. Kato T, Murata Y, Miura K, Asai K, Horton PB, Koji T, Fujibuchi W. (2006) Network-based de-noising improves prediction from microarray data, BMC Bioinformatics. 7, S4
12. Noh SJ, Lee K, Paik H, Hur CG. (2006) TISA: tissue-specific alternative splicing in human and mouse genes. DNA Res. 5, 229-243
13. Zeeberg BR, Feng W, Wang G, Wang MD, Fojo AT, Sunshine M, Narasimhan S, Kane DW, Reinhold WC, Lababidi S, Bussey KJ, Riss J, Barrett JC, Weinstein JN. (2003) GoMiner: a resource for biological interpretation of genomic and proteomic data, Genome Biol. 4, R28
14. GeneSpring GX : Products & Services - GeneSpring GX Software
(http://www.chem.agilent.com/en-US/products/software/lifesciencesinformatics/genespringgx/pages/default.aspx)
15. Wingender E, Chen X, Hehl R, Karas H, Liebich I, Matys V, Meinhardt T, Prüss M, Reuter I, Schacherer F. (2000) TRANSFAC: an integrated system for gene expression regulation. Nucleic Acids Research. 28, 316-319
16. PathwayStudio : Products-pathway Studio
(http://www.ariadnegenomics.com/products/pathwaystudio/)
17. Eveland AL, McCarty DR, Koch KE. (2007) Transcript profiling by 3'-untranslated region sequencing resolves expression of gene families. Plant Physiol. 146, 32-44.
18. Torres TT, Metta M, Ottenwälder B, Schlötterer C. (2008) Gene expression profiling by massively parallel sequencing. Genome Res. 1, 172-7.
19. Vega-Arreguín JC, Ibarra-Laclette E, Jiménez-Moraila B, Martínez O, Vielle-Calzada JP, Herrera-Estrella L, Herrera-Estrella A. (2009) Deep sampling of the Palomero maize transcriptome by a high throughput strategy of pyrosequencing. BMC Genomics. 10, 299.
20. Wang ET, Sandberg R, Luo S, Khrebtukova I, Zhang L, Mayr C, Kingsmore SF, Schroth GP, Burge CB. (2008) Alternative isoform regulation in human tissue transcriptomes. Nature. 2456, 70-76.
21. Johnson JM, Castle J, Garrett-Engele P, Kan Z, Loerch PM, Armour CD, Santos R, Schadt EE, Stoughton R, Shoemaker DD. (2003) Genome-wide survey of human alternative pre-mRNA splicing with exon junction microarrays. Science. 302, 2141-2144.
22. Ledford H. (2008) Human genes are multitaskers. Nature. 456, 9.
23. CLC Genomics Workbench: RNA-Seq analysis
(http://www.clcbio.com/index.php?id=1330&manual=RNA_Seq_analysis.html)
Posted by 人Co
- Tag
- COG, DEGs, Expression, FunCat, Functional annotation, Gene Categorization, Gene Ontology, Hypergeometric test, insilicogen, MIPs, NGS, Ortholog Analysis, Pearson's correlation, 인실리코젠
- Response
- No Trackback , No Comment
- RSS :
- https://post-blog.insilicogen.com/blog/rss/response/49