Pathway Studio 9 Release!
- Posted at 2011/11/23 11:27
- Filed under 제품소식
Ariadne Genomics는 Pathway Studio 9과 MedScan Reader 5 버전을 출시하였습니다.
그럼 새로운 기능들과 향상된 기능들을 살펴볼까요?
Pathway Studio 9
◆ New Features to Expand Experimental Data Analysis
1. Two data types displayed in one pathway view
유전자 expression 또는 proteomics 데이터를 metabolomics 데이터와 함께 같은 pathway view 내에서 디스플레이가 가능합니다. 단순히 두 개의 실험 데이터와 pathway를 열면 링크버튼 위의 experiment table에서 두 개의 실험 데이터를 tab 방식으로 확인할 수 있습니다.
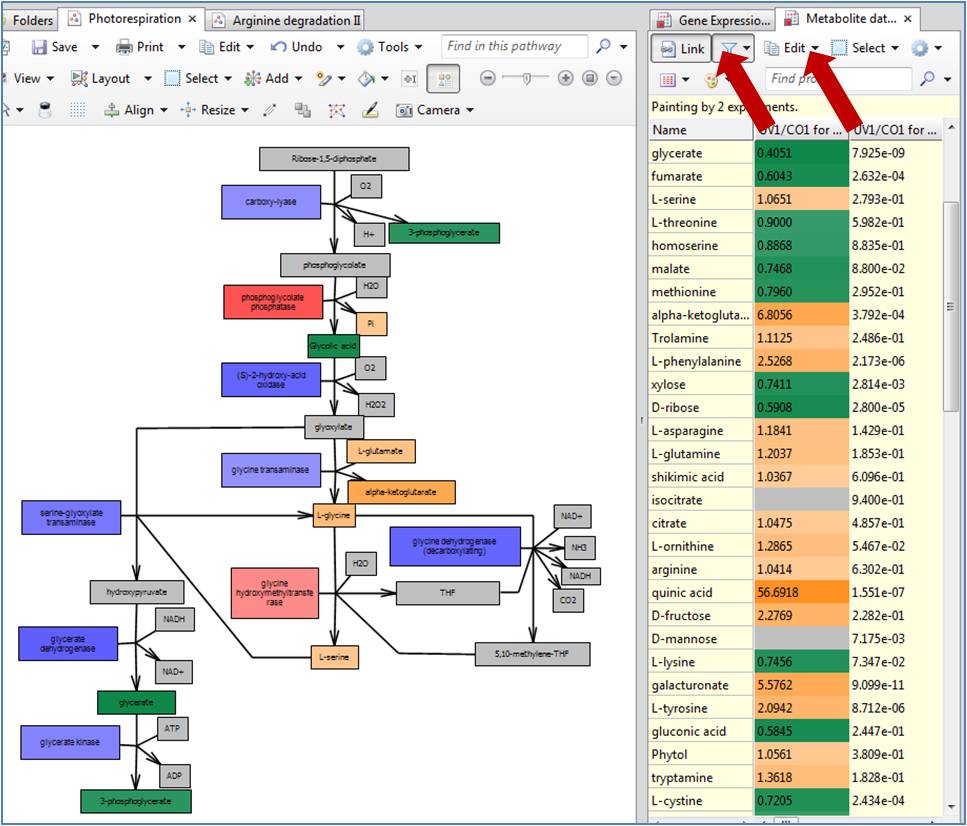 Figure 1. An example of a metabolic pathway with both gene expression values and metabolomic values displayed on the pathway entities.
* Small molecules : green -> orange (decrease -> increase)
* Gene expression : blue -> read (decrease -> increase)
2. Experiment values displayed in group view
이전 버전에서는 experimental value는 오직 pathway view에서만 볼 수 있었습니다. 허나 이제는 group viewer에서도 그 값을 확인할 수 있습니다. Link 버튼으로 group viewer table과 연결되어 probe value 컬러와 수치 값이 보여집니다.
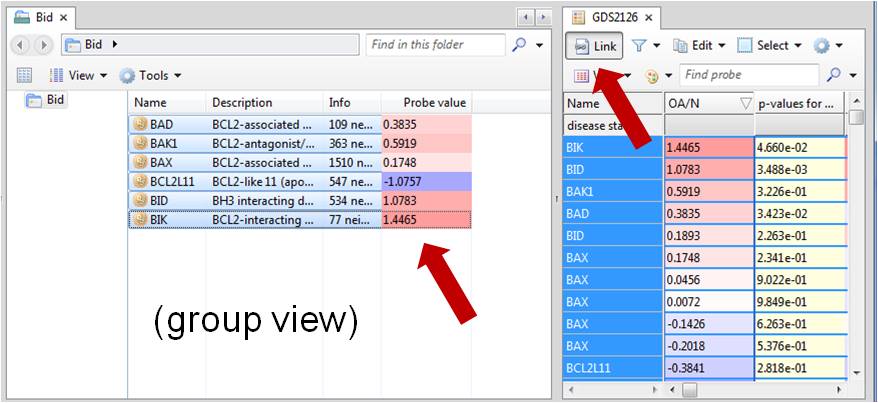 Figure 2. Probe value colors and text are displayed in the Group Viewer table.
하나의 유전자에서 multi probes로 분석이 진행될 때 group viewer에서 probe value는 평균값을 제공하는 옵션도 가능하며, default 세팅은 각 유전자별로 가장 p-value가 높은 probe의 value로서 확인됩니다.
 Figure 3. Program options menu for selecting how values for multiple probes will be displayed.
3. GSEA results display entities in order of measured value
GSEA 분석의 결과 테이블도 향상되었습니다. 분석된 "measured entities"컬럼은 엔티티들의 리스트와 연동되어 최대값과 최소값으로 설정된 범위의 fold change 값을 함께 컬러로 나타낼 수 있도록 할 수 있습니다.
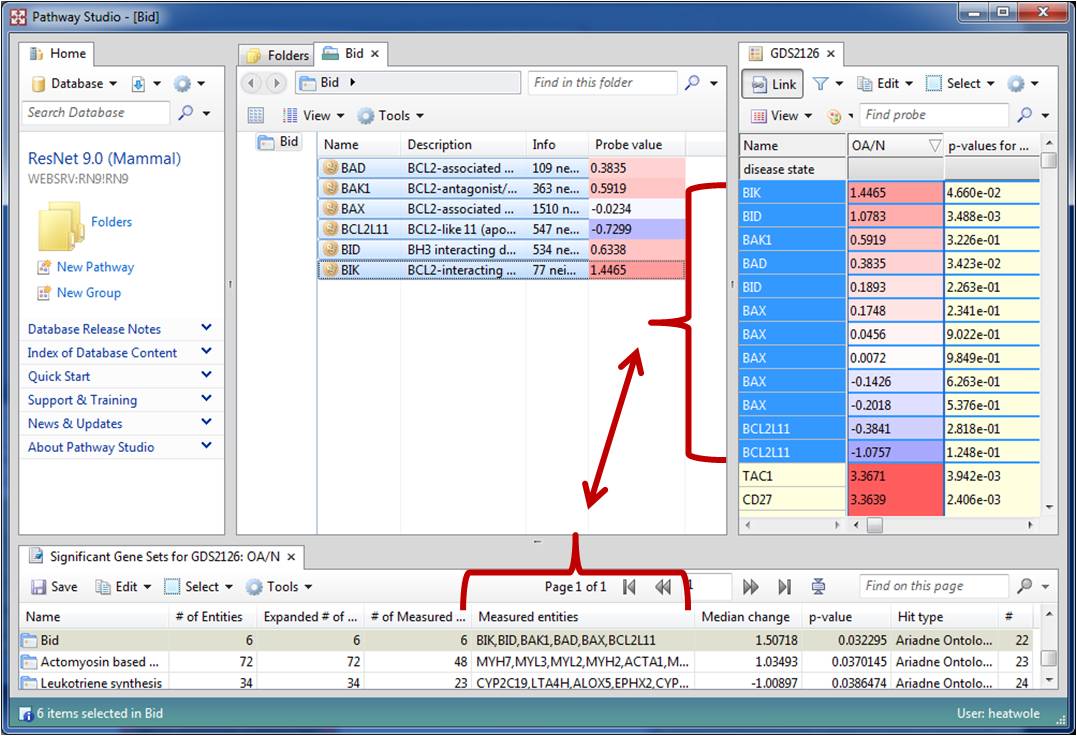 Figure 4. Measured entities in the GSEA results table are now listed in order of measured value.
또한 GSEA의 "Sample to analyze" 옵션으로 experiment table의 최소한의 혼란을 위하여 원하는 항목을 적절하게 선택을 통하여 제한할 수 있습니다. 이전에는 p-value 컬럼이 포함된 모든 컬럼이 테이블 내에 디스플레이 되었었습니다.
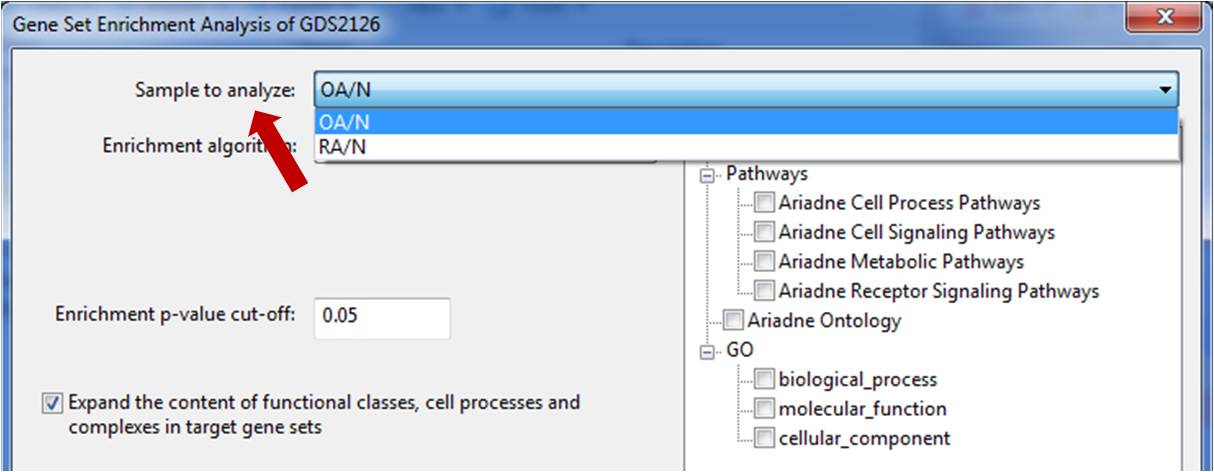 Figure 5. Only appropriate selections are available for GSEA analysis (P-values no longer appear in the "sample to analyze" menu).
4. Correlation viewer available after experiment import
Correlation view가 experiment properties내에 tab으로 추가 되었습니다. 향상된 기능으로부터 large correlation plots은 화면에서 스크롤링 없이도 쉽게 볼 수 있습니다.
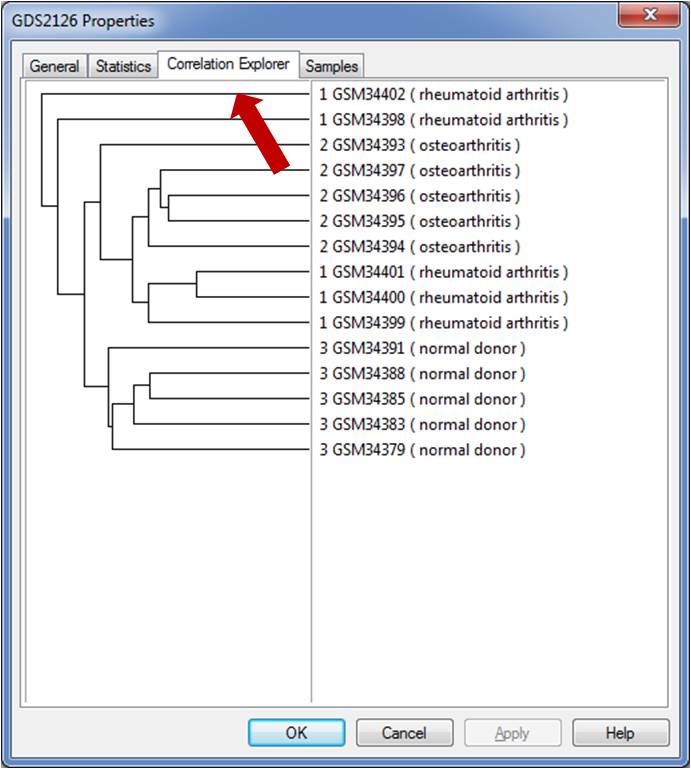 Figure 6. The correlation view is now accessible as a tab in the experiment properties and can be accessed after the experiment import is complete.
5. Chromosomal localization enrichment with Fisher's Exact Test
Fisher's Exact Test 알고리즘에 적용되는 유전자/단백질들의 리스트를 대상으로 chromosomal enrichment 분석을 할 수 있습니다. 현재 mammalian GSEA 분석을 위하여 사용할 수 있도록 준비되어 있습니다.
 Figure 7. Chromosomal enrichment is now available for mammalian Fisher's Exact Test analysis.
6. Colored experiment values can be exported to Excel
Experiment table 내의 컬러 value들을 MS Excel spreadsheet로 함께 export가 가능합니다. 컬러 intensity 또는 컬러 value는 세팅 옵션에서 쉽게 조절할 수 있습니다.
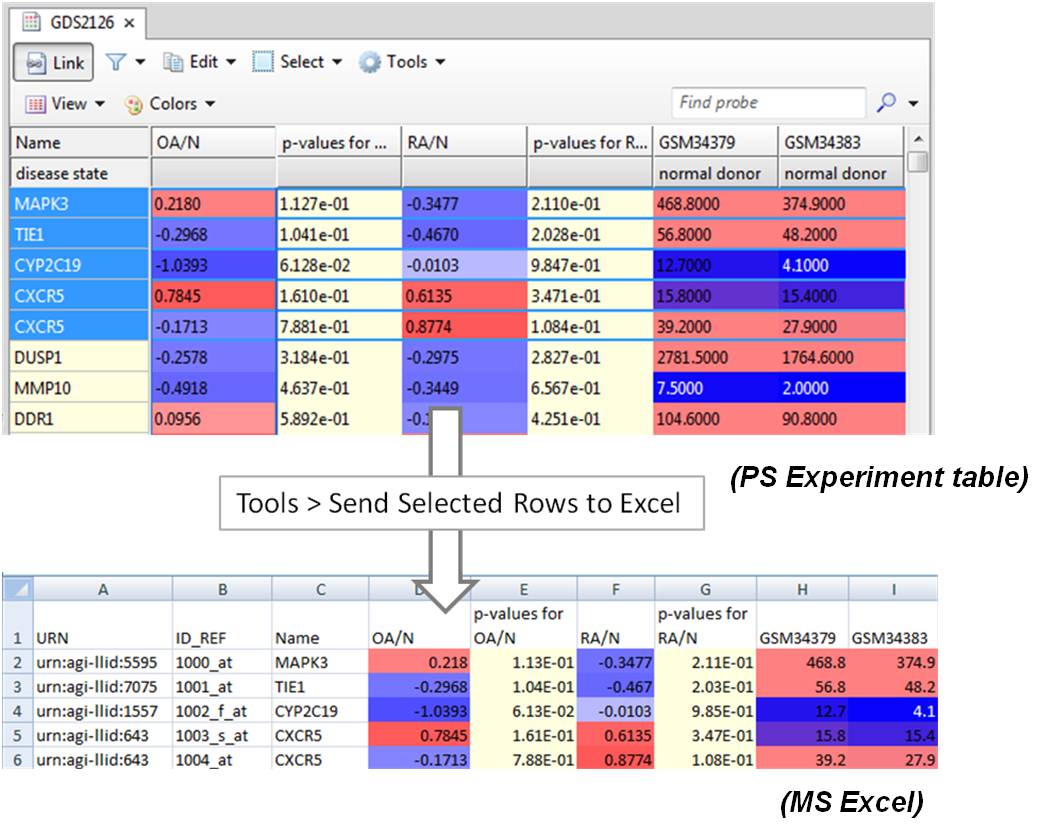 Figure 8. The color display in the experiment table can now be exported to an Excel spreadsheet.
◆ New Capabilities for Visualizing Pathways
1. Options for initial pathway results views
Pathway 작업을 위하여 추가된 기능 중에는 새롭게 만들어진 pathway 결과를 graph view 또는 table view에 선택하여 열수 있는 옵션이 포함되었습니다. 또한 Advanced build pathway wizard를 사용하면 graph, entity table, relation table 또는 reference table view를 먼저 선택할 수 있습니다.
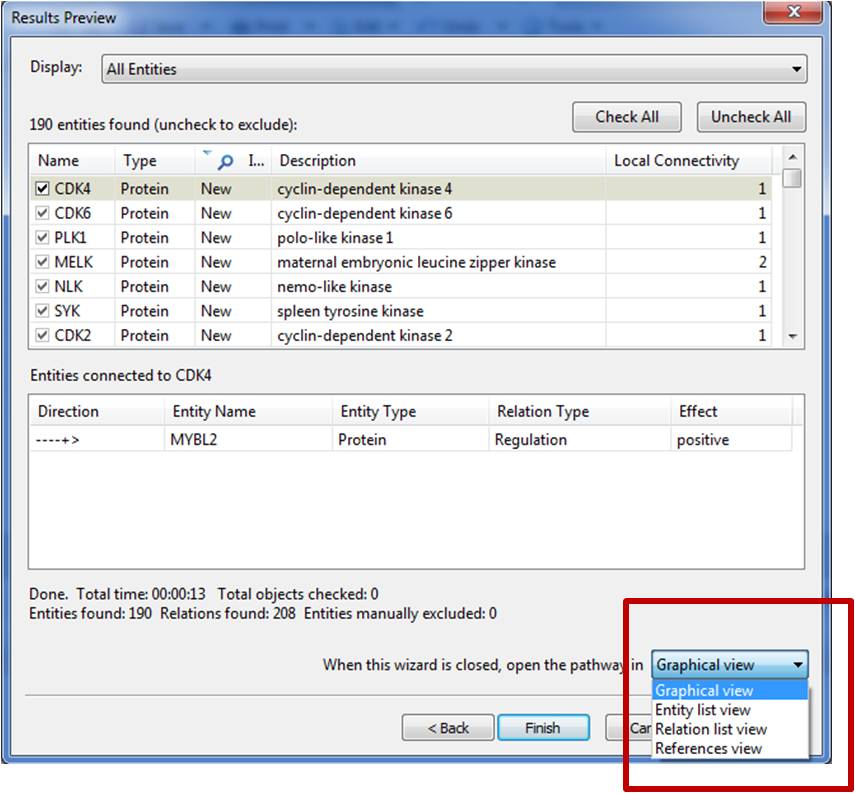 Figure 9. After completion of the Advanced tool for building pathways,
the initial view for results can be selected by the user.
Figure 9. After completion of the Advanced tool for building pathways,
the initial view for results can be selected by the user.
2. Easily adjust font size on entities in Pathway View
네트워크상의 single entity를 위한 텍스트 사이즈를 쉽게 조정할 수 있습니다. 원하는 엔티티 내 텍스트의 노란 도형을 선택하여 드래그하여 이용하면 됩니다.
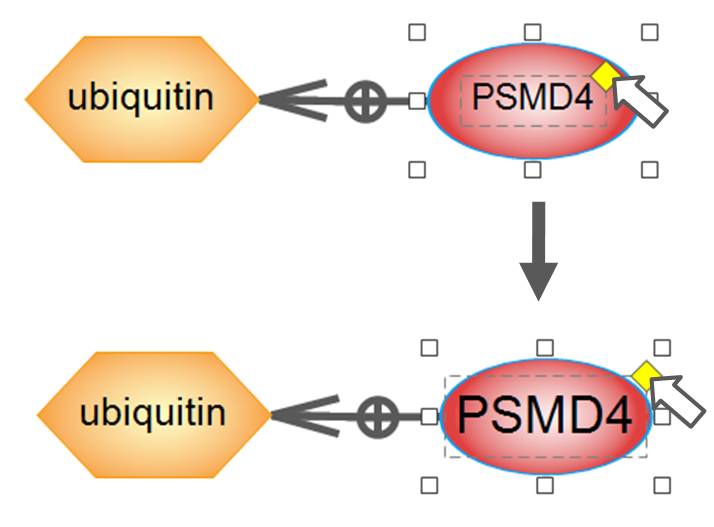 Figure 10. Font size for individual entities within a network can easily be resized.
3. Functional Class association tabs renamed
Functional Class 내의 단백질들의 membership을 구성할 때 새로운 tab을 조사한 특징을 이름으로 확인할 수 있도록 만들 수 있습니다. 예를 들어, "Members"라는 tab을 “Child Concepts"로 또는 ”Parent Concepts" tab을 바꾸어 분석 조건에 알맞게 사용할 수 있습니다.
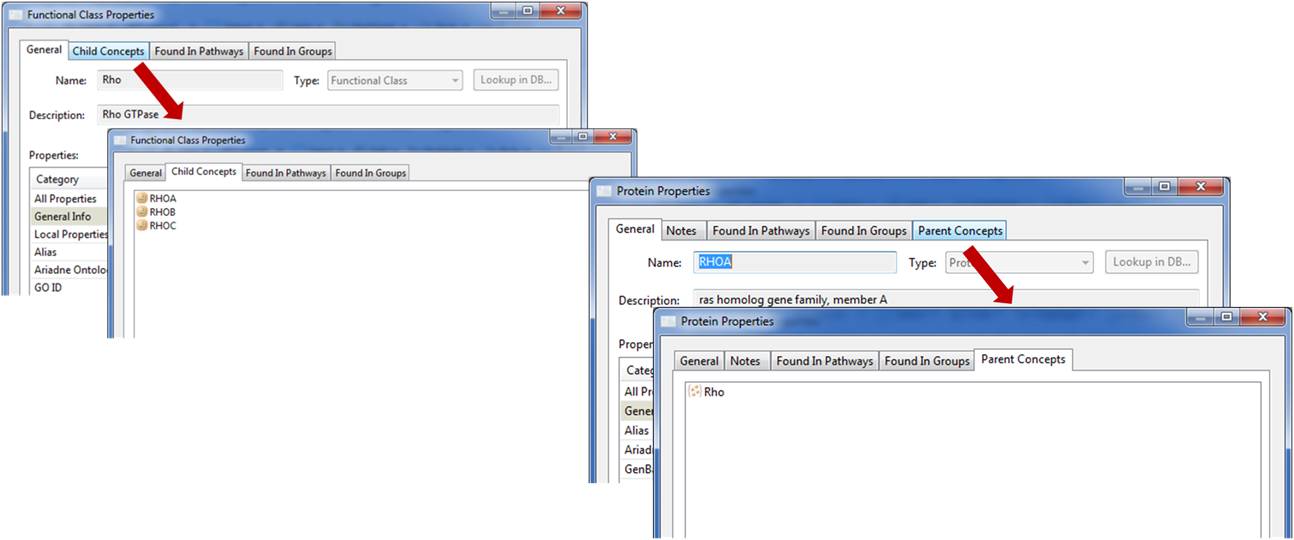 Figure 11. The tabs containing information about the association of
proteins to functional classess have been renamed for more clarity.
Figure 11. The tabs containing information about the association of
proteins to functional classess have been renamed for more clarity.
MedScan Reader 5
◆ Dictionary and Algorithm Improvements
Entrez로부터 2011년 봄 기준으로 Protein 정의 업데이트가 진행되었으며 functional class dictionaries 큐레이트를 통하여 non-mammalian classes를 제거하고 가장 최신의 Gene Ontology를 나타내도록 변경되었습니다. 또한 MeSH로부터 새롭고 많은 aliases가 disease dictionaries에 추가되었습니다. 그리고 MedScan5에서는 텍스트 마이닝을 명확하게 하는 알고리즘이 향상되었고 애매모호한 단어들을 조금 더 명확하게 해석이 가능하도록 중점을 두어 업그레이드가 되었습니다.
◆ End User Editing of MedScan Dictionaries
이전에는 사용자 인터페이스 내의 제한으로 entity 용어를 추가한다거나 aliases를 추가하는 등의 MedScan dictionary 편집은 특별한 등록 키를 Ariadne에서 제공한 사용자만이 사용할 수 있었습니다. 이번 MedScan5 는 dictionary 편집과 인터페이스의 확장을 모든 사용자가 추가의 라이센스 활성화 없이도 이용할 수 있게 되었습니다. 이를 통하여 사용자들은 그들이 원하는데로 dictionary들을 modify 할 수 있습니다.
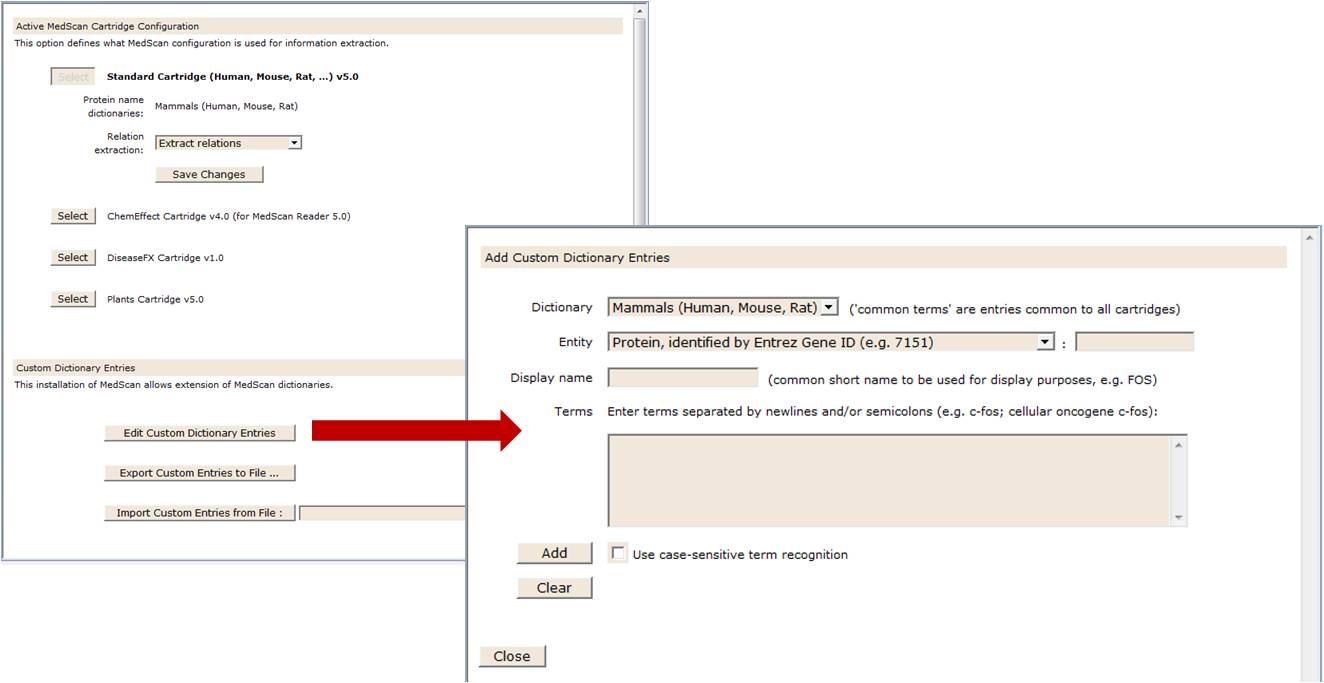 Figure 12. MedScan Dictionary editing enabled
ResNet Database 9
◆ Mammalian database
▪ Organism 특이적 functional class 큐레이션 (non-mammalian classes 제거)
▪ 질병 레코드에 더 많은 aliases 추가
▪ 새로운 Ariadne Cell Process pathway 수집
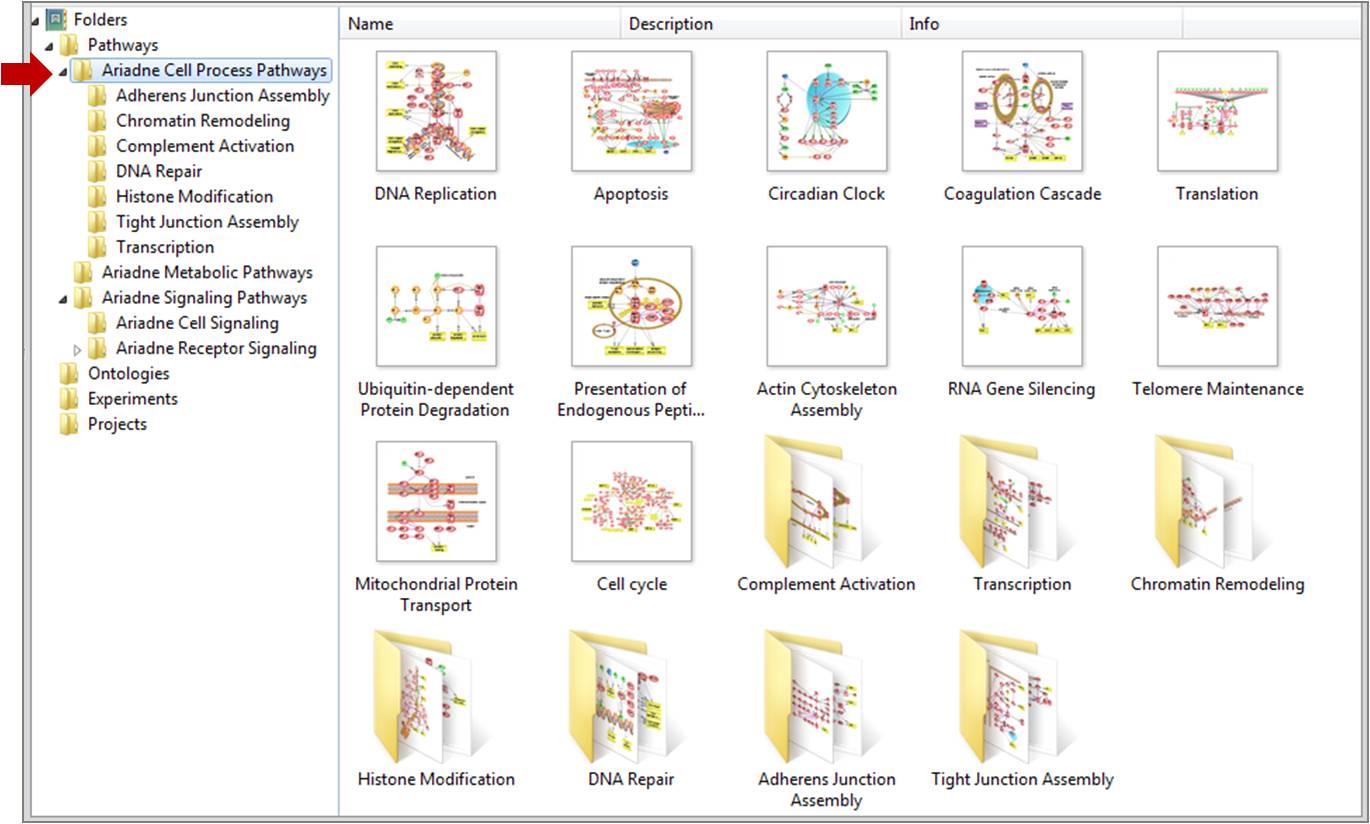 Figure 13. New - Cell Process pathway collection
▪ miRNA effect를 예측하는 relation이 포함
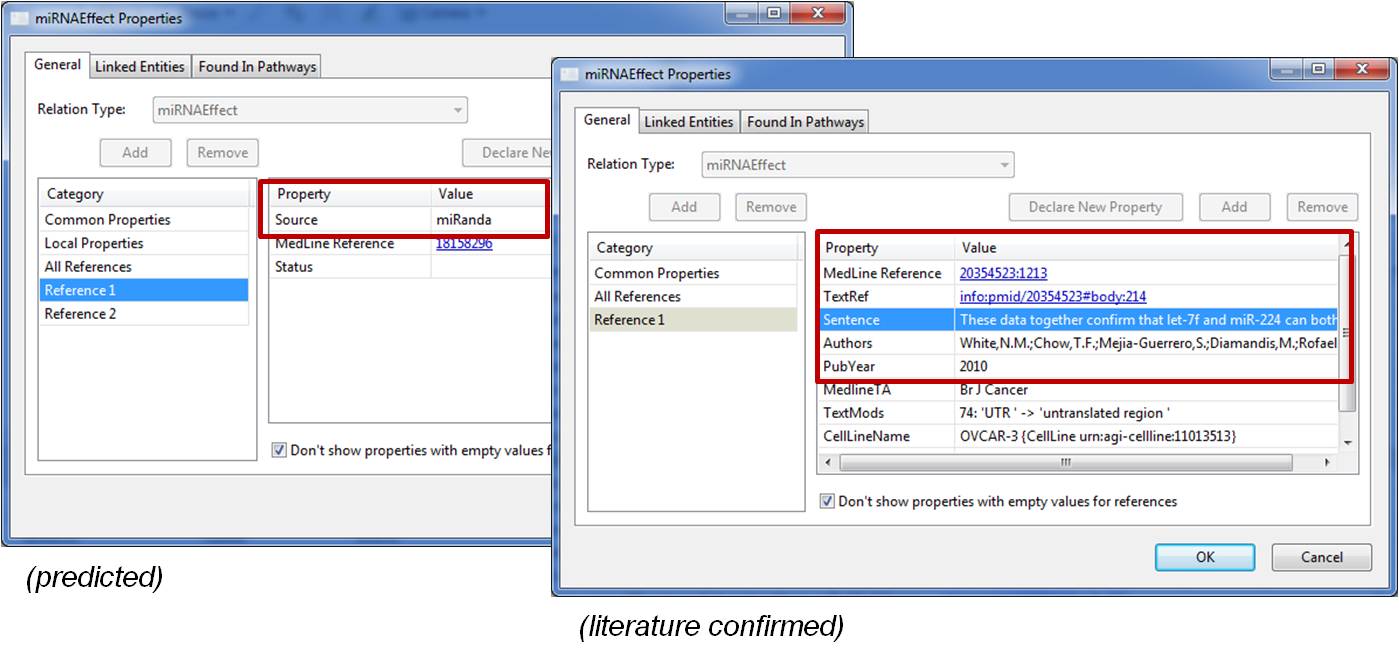 Figure 14. miRNAEffect predicted relations included in ResNet 9
▪ 더 많은 metabolic pathway 추가
▪ 2배 이상의 full-text articles 포함
◆ Plant database
▪ 데이터베이스 내 relation 컨텐츠의 15% 이상 증가
▪ Organism 특이적 functional class 큐레이션 (non-plant classes 제거)
▪ Signaling pathway들의 수집을 확대하고 다시 작업하여 완성
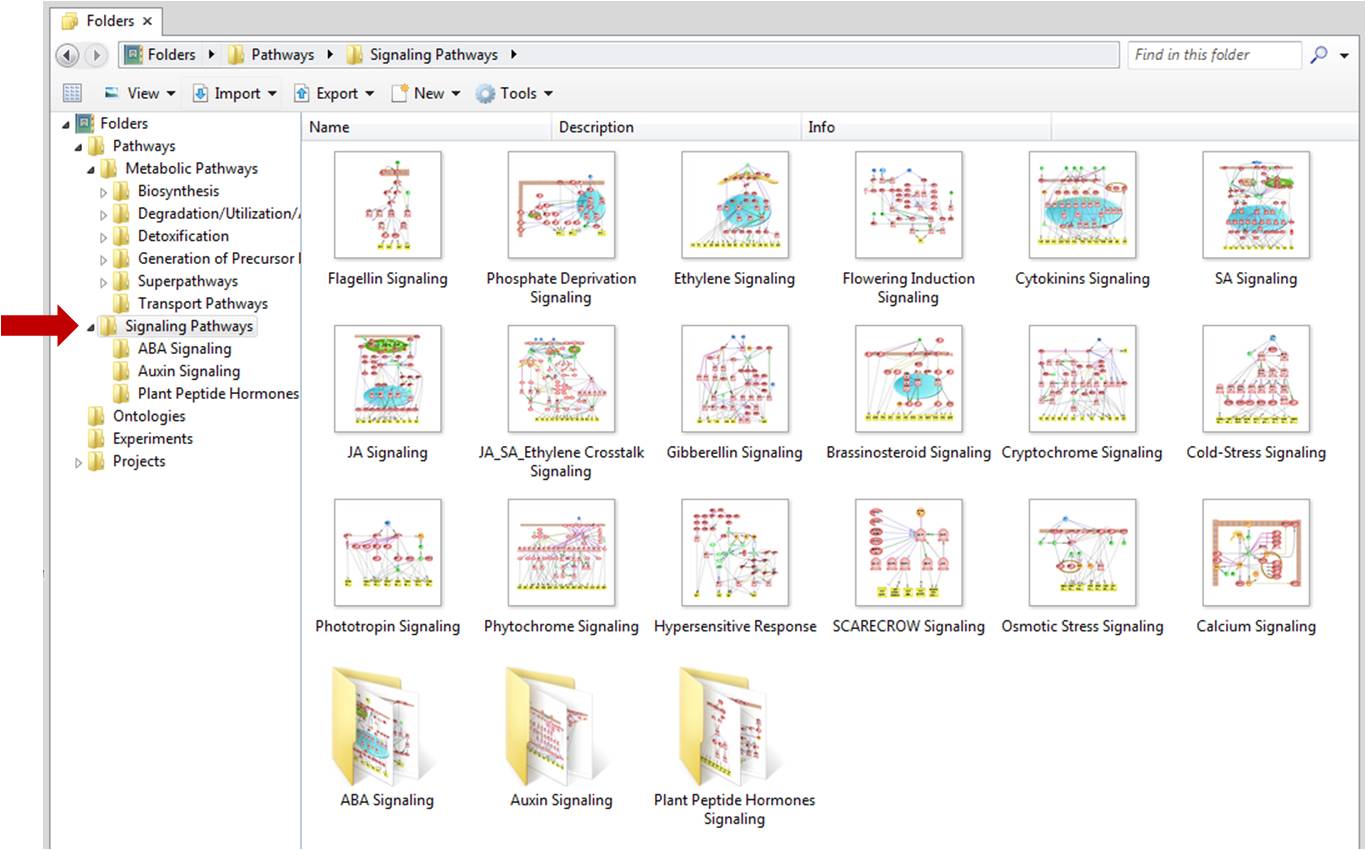 Figure 15. Updated Signaling Pathway
▪ AraCyc로부터 더 많은 metabolic pathway들의 추가
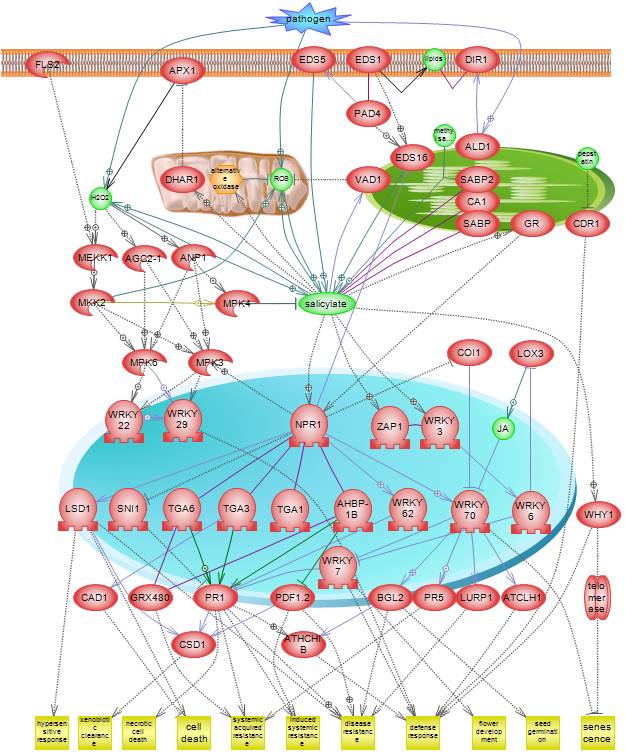 Figure 16. Updated SA(Salicyclic acid) Pathway
그럼 새로운 기능들과 향상된 기능들을 살펴볼까요?
Pathway Studio 9
◆ New Features to Expand Experimental Data Analysis
1. Two data types displayed in one pathway view
유전자 expression 또는 proteomics 데이터를 metabolomics 데이터와 함께 같은 pathway view 내에서 디스플레이가 가능합니다. 단순히 두 개의 실험 데이터와 pathway를 열면 링크버튼 위의 experiment table에서 두 개의 실험 데이터를 tab 방식으로 확인할 수 있습니다.
* Small molecules : green -> orange (decrease -> increase)
* Gene expression : blue -> read (decrease -> increase)
2. Experiment values displayed in group view
이전 버전에서는 experimental value는 오직 pathway view에서만 볼 수 있었습니다. 허나 이제는 group viewer에서도 그 값을 확인할 수 있습니다. Link 버튼으로 group viewer table과 연결되어 probe value 컬러와 수치 값이 보여집니다.
하나의 유전자에서 multi probes로 분석이 진행될 때 group viewer에서 probe value는 평균값을 제공하는 옵션도 가능하며, default 세팅은 각 유전자별로 가장 p-value가 높은 probe의 value로서 확인됩니다.
3. GSEA results display entities in order of measured value
GSEA 분석의 결과 테이블도 향상되었습니다. 분석된 "measured entities"컬럼은 엔티티들의 리스트와 연동되어 최대값과 최소값으로 설정된 범위의 fold change 값을 함께 컬러로 나타낼 수 있도록 할 수 있습니다.
또한 GSEA의 "Sample to analyze" 옵션으로 experiment table의 최소한의 혼란을 위하여 원하는 항목을 적절하게 선택을 통하여 제한할 수 있습니다. 이전에는 p-value 컬럼이 포함된 모든 컬럼이 테이블 내에 디스플레이 되었었습니다.
4. Correlation viewer available after experiment import
Correlation view가 experiment properties내에 tab으로 추가 되었습니다. 향상된 기능으로부터 large correlation plots은 화면에서 스크롤링 없이도 쉽게 볼 수 있습니다.
5. Chromosomal localization enrichment with Fisher's Exact Test
Fisher's Exact Test 알고리즘에 적용되는 유전자/단백질들의 리스트를 대상으로 chromosomal enrichment 분석을 할 수 있습니다. 현재 mammalian GSEA 분석을 위하여 사용할 수 있도록 준비되어 있습니다.
6. Colored experiment values can be exported to Excel
Experiment table 내의 컬러 value들을 MS Excel spreadsheet로 함께 export가 가능합니다. 컬러 intensity 또는 컬러 value는 세팅 옵션에서 쉽게 조절할 수 있습니다.
◆ New Capabilities for Visualizing Pathways
1. Options for initial pathway results views
Pathway 작업을 위하여 추가된 기능 중에는 새롭게 만들어진 pathway 결과를 graph view 또는 table view에 선택하여 열수 있는 옵션이 포함되었습니다. 또한 Advanced build pathway wizard를 사용하면 graph, entity table, relation table 또는 reference table view를 먼저 선택할 수 있습니다.
2. Easily adjust font size on entities in Pathway View
네트워크상의 single entity를 위한 텍스트 사이즈를 쉽게 조정할 수 있습니다. 원하는 엔티티 내 텍스트의 노란 도형을 선택하여 드래그하여 이용하면 됩니다.
3. Functional Class association tabs renamed
Functional Class 내의 단백질들의 membership을 구성할 때 새로운 tab을 조사한 특징을 이름으로 확인할 수 있도록 만들 수 있습니다. 예를 들어, "Members"라는 tab을 “Child Concepts"로 또는 ”Parent Concepts" tab을 바꾸어 분석 조건에 알맞게 사용할 수 있습니다.
MedScan Reader 5
◆ Dictionary and Algorithm Improvements
Entrez로부터 2011년 봄 기준으로 Protein 정의 업데이트가 진행되었으며 functional class dictionaries 큐레이트를 통하여 non-mammalian classes를 제거하고 가장 최신의 Gene Ontology를 나타내도록 변경되었습니다. 또한 MeSH로부터 새롭고 많은 aliases가 disease dictionaries에 추가되었습니다. 그리고 MedScan5에서는 텍스트 마이닝을 명확하게 하는 알고리즘이 향상되었고 애매모호한 단어들을 조금 더 명확하게 해석이 가능하도록 중점을 두어 업그레이드가 되었습니다.
◆ End User Editing of MedScan Dictionaries
이전에는 사용자 인터페이스 내의 제한으로 entity 용어를 추가한다거나 aliases를 추가하는 등의 MedScan dictionary 편집은 특별한 등록 키를 Ariadne에서 제공한 사용자만이 사용할 수 있었습니다. 이번 MedScan5 는 dictionary 편집과 인터페이스의 확장을 모든 사용자가 추가의 라이센스 활성화 없이도 이용할 수 있게 되었습니다. 이를 통하여 사용자들은 그들이 원하는데로 dictionary들을 modify 할 수 있습니다.
ResNet Database 9
◆ Mammalian database
▪ Organism 특이적 functional class 큐레이션 (non-mammalian classes 제거)
▪ 질병 레코드에 더 많은 aliases 추가
▪ 새로운 Ariadne Cell Process pathway 수집
▪ miRNA effect를 예측하는 relation이 포함
▪ 더 많은 metabolic pathway 추가
▪ 2배 이상의 full-text articles 포함
◆ Plant database
▪ 데이터베이스 내 relation 컨텐츠의 15% 이상 증가
▪ Organism 특이적 functional class 큐레이션 (non-plant classes 제거)
▪ Signaling pathway들의 수집을 확대하고 다시 작업하여 완성
▪ AraCyc로부터 더 많은 metabolic pathway들의 추가
Posted by 人Co
- Response
- No Trackback , No Comment
- RSS :
- https://post-blog.insilicogen.com/blog/rss/response/99
Trackback URL : 이 글에는 트랙백을 보낼 수 없습니다